One silent outstation on a multidrop line: finding it in a DNP3 capture
A multidrop channel, one IP and port with several outstations behind it, is the classic place for a problem to hide. The TCP
connection stays up, most outstations answer, and the SCADA shows a few stale values that nobody can pin on a device. This case walks
through one: three outstations on 10.0.1.18:20000, one of which stops answering twice for about 90 seconds.
What the master sees
The master polls the line every 5 seconds for outstation 18 and on a slower cycle for 19 and 21, with a 3-second response timeout and 2 retries. When outstation 19 goes quiet, each poll to it expires, is retried twice with the same application sequence number, and the master moves on. TCP has nothing to report: the connection is healthy and the other two outstations keep answering on it in about 21 ms.
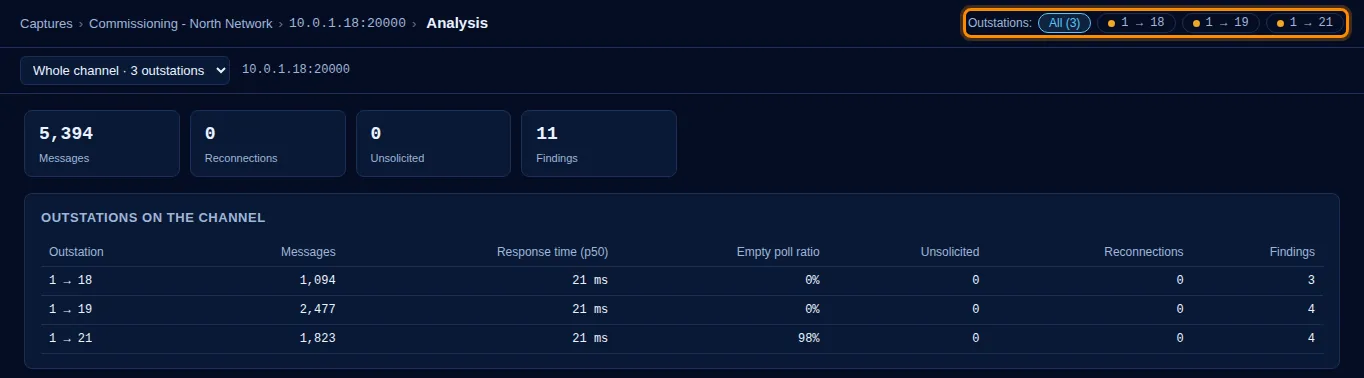
That is why a per-connection view misses it. The channel's TCP statistics show zero retransmissions and zero reconnections. The problem only appears when the traffic is split per DNP3 address.
Ranking the outstations
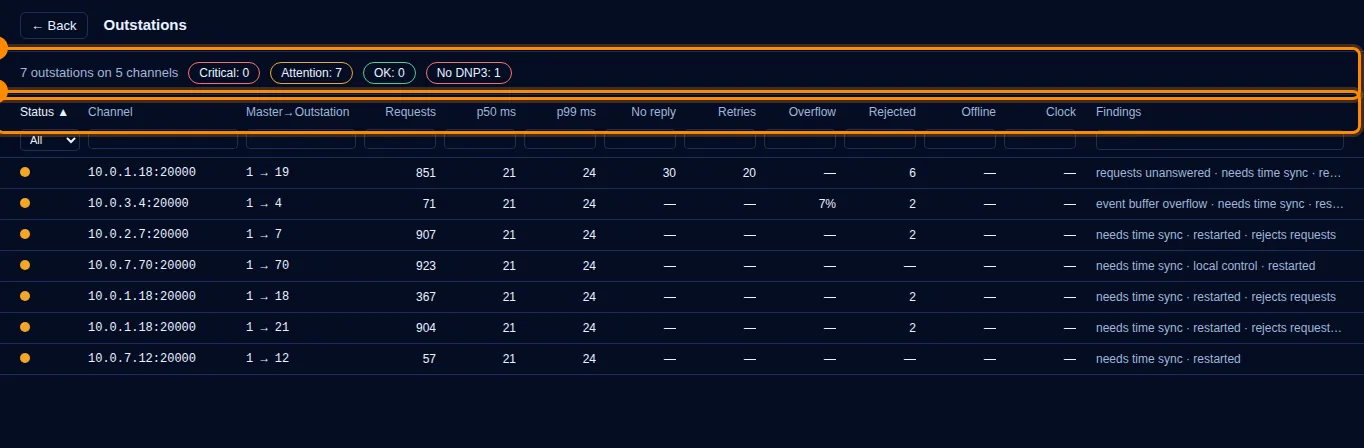
Three numbers tell the story:
- 30 unanswered requests out of 851, about 3.5%. A request counts as unanswered when the master gives up and sends something else before any response arrives.
- 20 retries: requests sent again with the same sequence and function, the master's own retry logic at work.
- Events up to 97 seconds late. Events that occurred while the outstation was silent were only collected when it came back, so their timestamps are far older than their arrival time.
The response times (p50 21 ms, p99 24 ms) are a trap: they only describe the requests that were answered. A device that answers quickly or not at all has a perfect p99.
Confirming on the channel
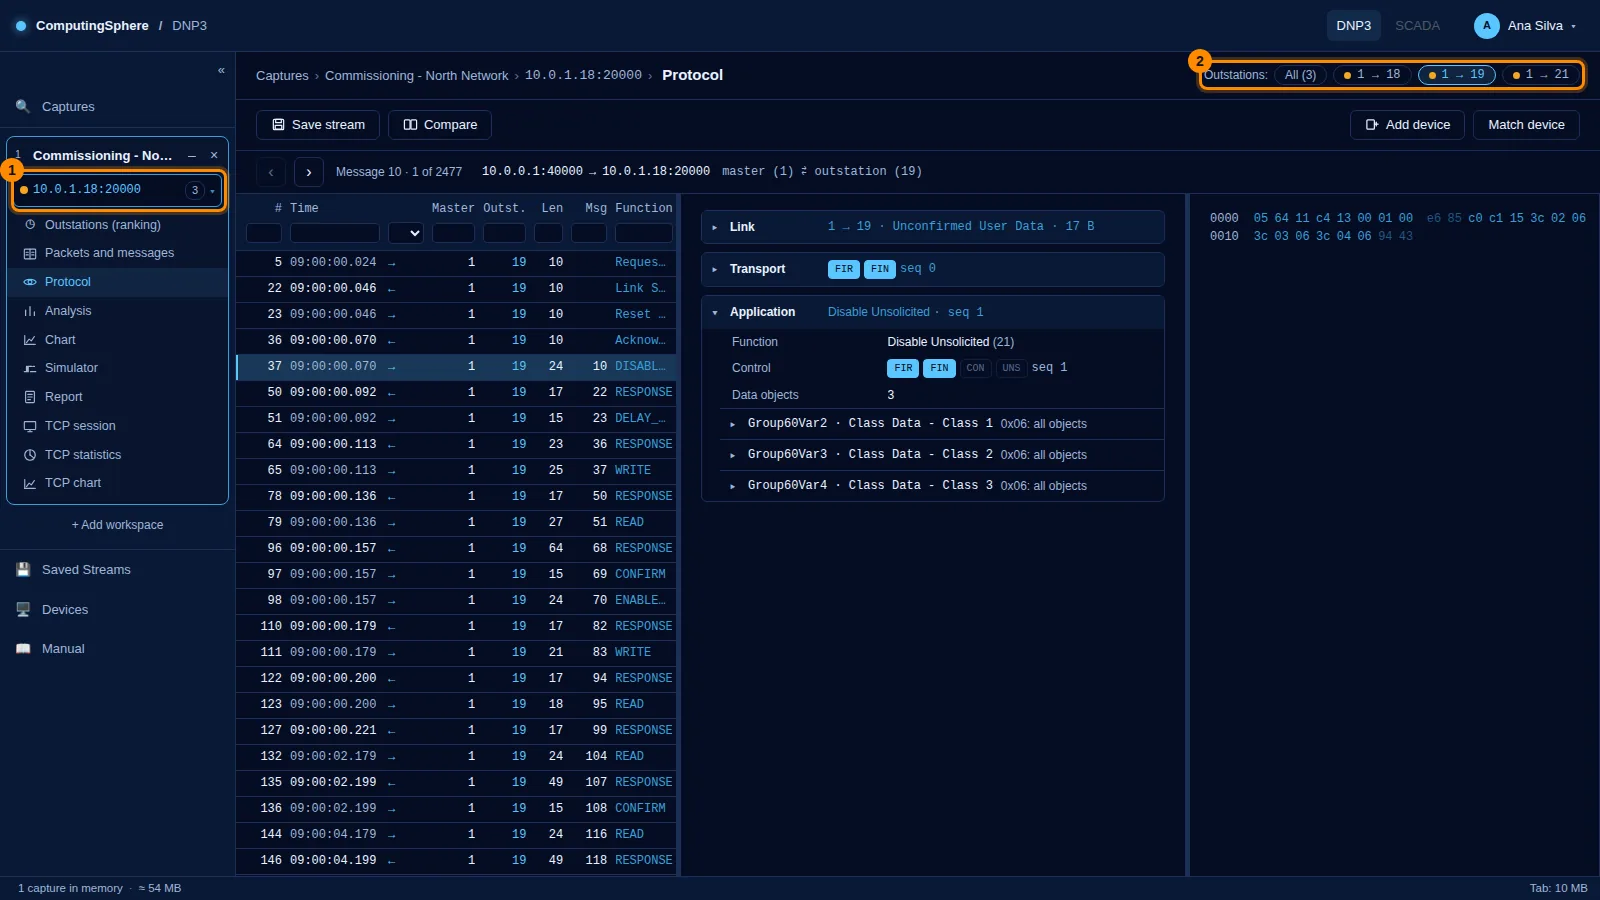
Filtering the protocol view to outstation 19 shows the gaps directly: runs of READ requests with no RESPONSE between them, each one repeated, then the startup sequence again (DISABLE_UNSOLICITED, integrity poll) when it starts answering. The master re-runs the startup three times over the capture, once at the beginning and once after each outage, which is a useful fingerprint: a device that keeps "restarting" from the master's point of view without ever setting DEVICE_RESTART is losing communication, not rebooting.
What to check in the field
- A serial-to-TCP gateway in front of the line: one port flapping or a device losing power on its own feed.
- Addressing: two devices configured with the same address answer on top of each other and corrupt frames, which looks different (CRC errors, noise) from clean silence.
- Timing: if the silences line up with a schedule (every N minutes), look for something periodic on the device, such as a logging task or a radio duty cycle.
Try it on your own capture
ComputingSphere DNP3 decodes a pcap once, splits it per channel and per outstation, and ranks the outstations worst first with the same numbers used here. It only reads what already went over the wire. Multidrop lines are split per DNP3 address automatically. This capture is among the examples of every free account, to reproduce every number in this post; or upload your own: the Free plan covers 1,000 messages a month.
More cases from the same capture
- NEED_TIME on 904 responses: a DNP3 outstation the master never syncs
- Why a DNP3 SELECT/OPERATE fails: timeout, unsupported point and local control
- DNP3 event buffer overflow: losing events between polls
- Tuning a chatter filter from a DNP3 capture: 26 updates down to 6
- 204 SYN retransmissions and no DNP3: an unreachable outstation in a capture
- Self-healing on stale data: three DNP3 problems a FLISR scheme should not meet
- The substation GPS that overwrote the master: DNP3 events an hour in the future