DNP3 protocol analyzer & decoder
Your capture already knows what is wrong with the RTU. We make it say so.
Upload a pcap. In minutes, every RTU has a verdict, every problem is written in plain words, and the report comes out in your team's format — with each message decoded underneath to prove it.
Free plan: 1,000 DNP3 messages a month · no credit card · made & hosted in Sweden
- Per RTUverdict and findings, even 30 RTUs behind one gateway
- Byte by bytelink, transport, application, IIN and points
- TCP includedretransmissions, resets and reconnections, with the reason
- Your reportyour cover, your sections, your team's templates
Automatic findings
The problems are found for you, RTU by RTU
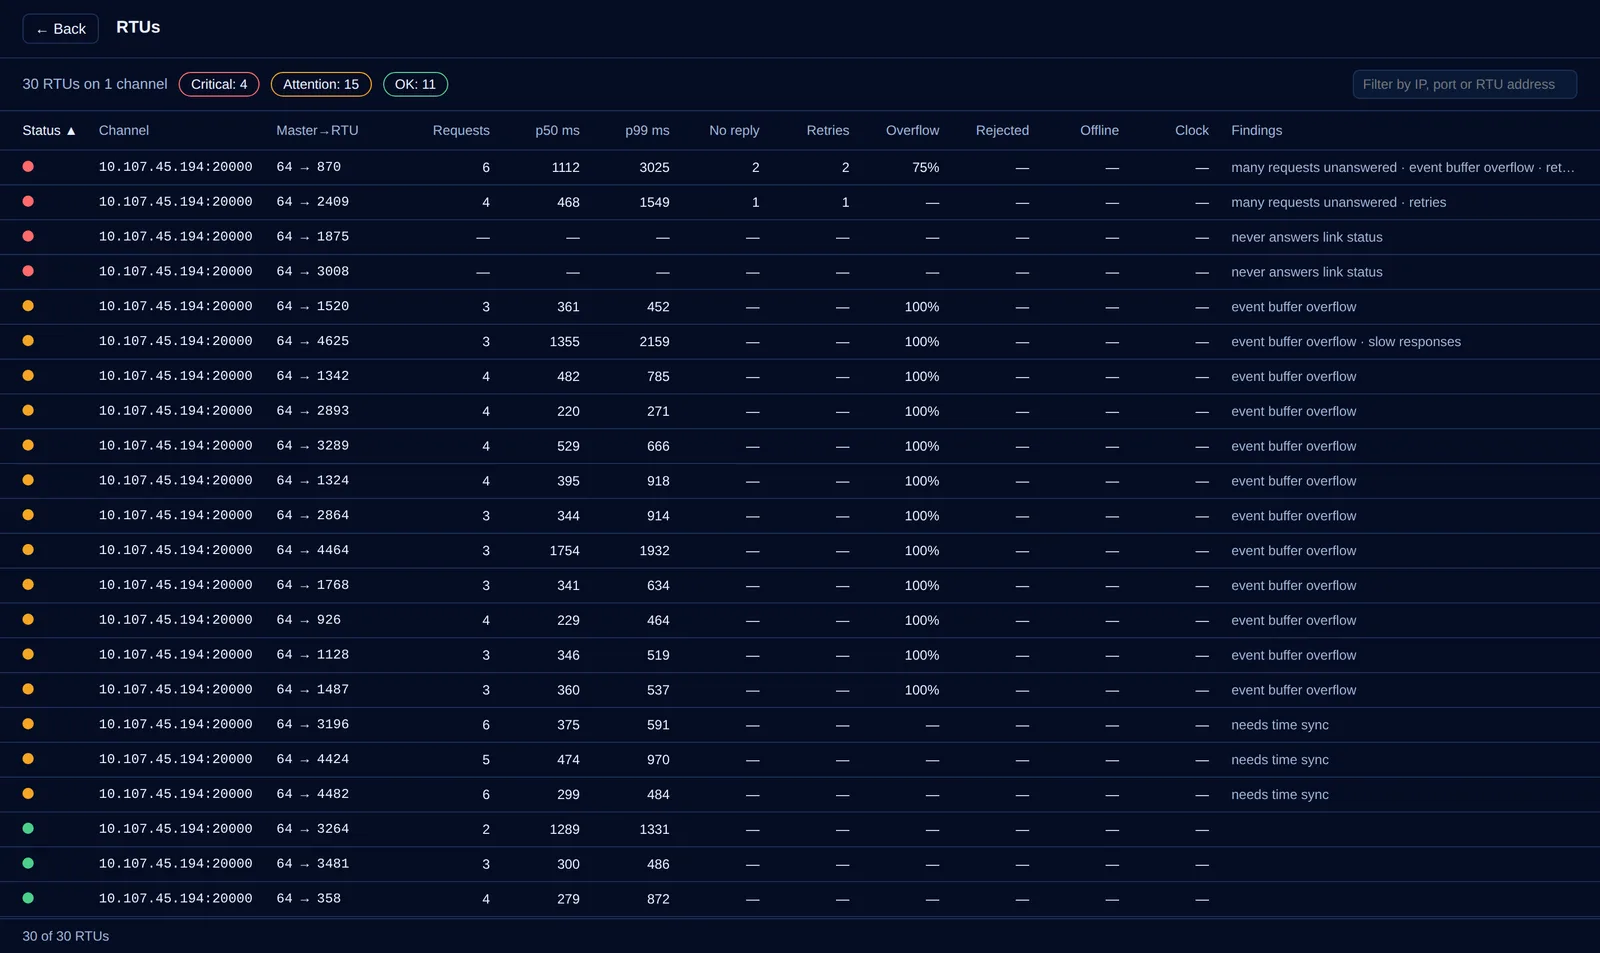
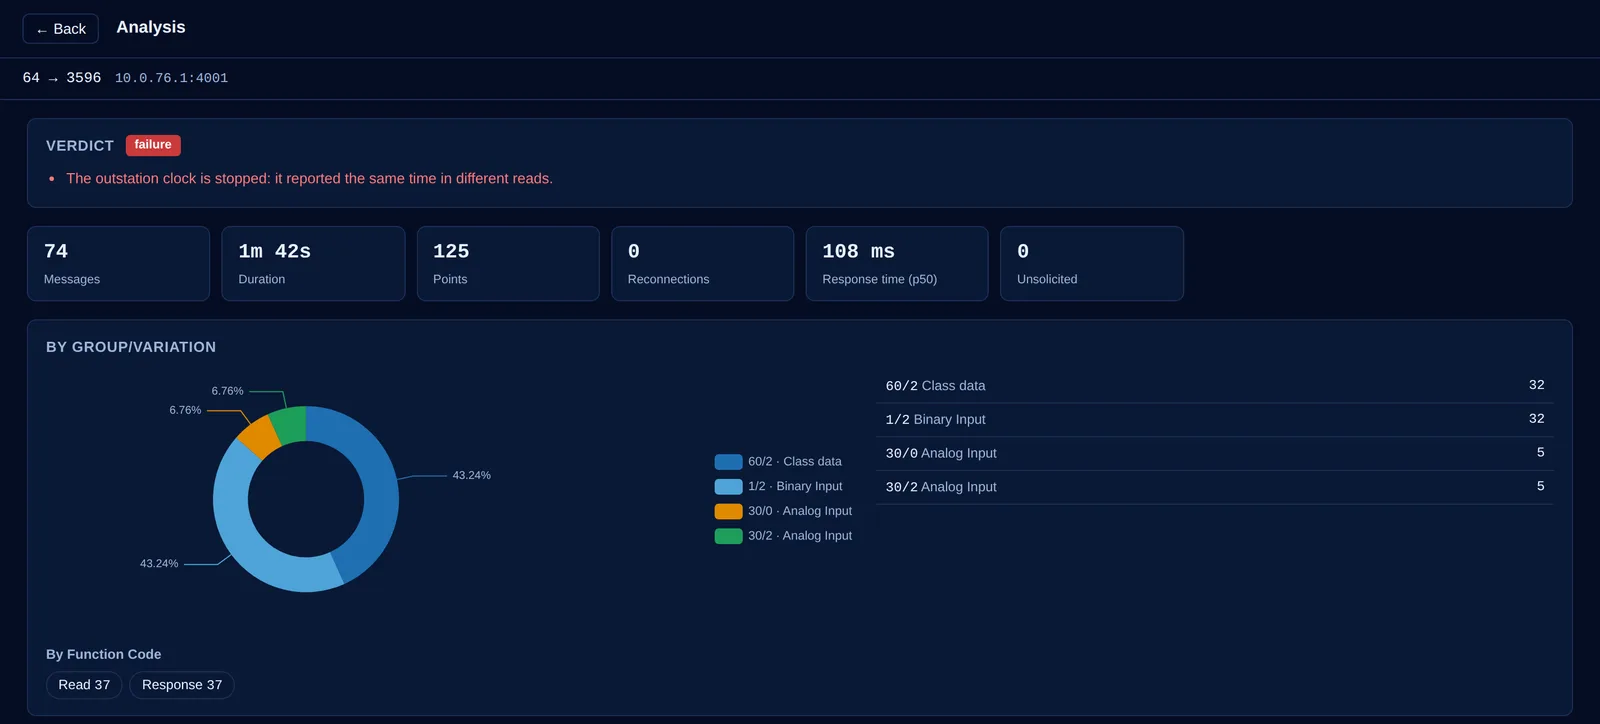
Every RTU in the capture gets a verdict — OK, Attention or Failed — and a list of findings written so that both the commissioning engineer and the client understand them. Thirty RTUs behind one gateway? One table, the ones that need you first.
Clock stopped
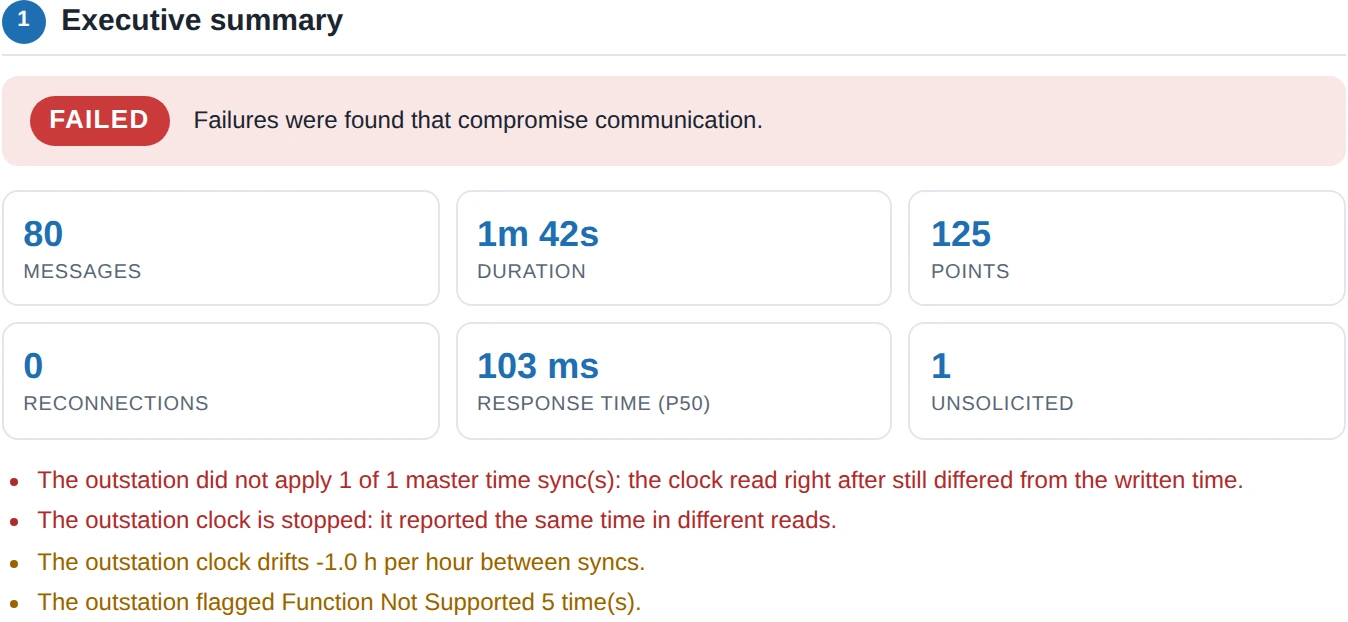
The RTU reported the same time in different reads — its event timestamps can't be trusted.
Clock drift
The RTU's clock walks away from the master's between two synchronizations.
Time sync not applied
The RTU asked for time (IIN1.4) and the master never fixed it before the capture ended.
Event buffer overflow
Events lost before the master read them (IIN2.3) — the alarms that never reached the control room.
Unanswered requests
Polls the RTU never answered, slow responses and late confirmations, counted and dated.
Failed commands
SELECT/OPERATE and direct operate refused, mismatched or out of time.
IIN flags that matter
Function not supported, device restart, local control, parameter error — how many times, in which responses.
Restarts and reconnections
Every TCP reconnection with its reason: closed by the RTU, by the master, reset, or vanished without a word.
Customizable reports
Standardized reports, built from your templates
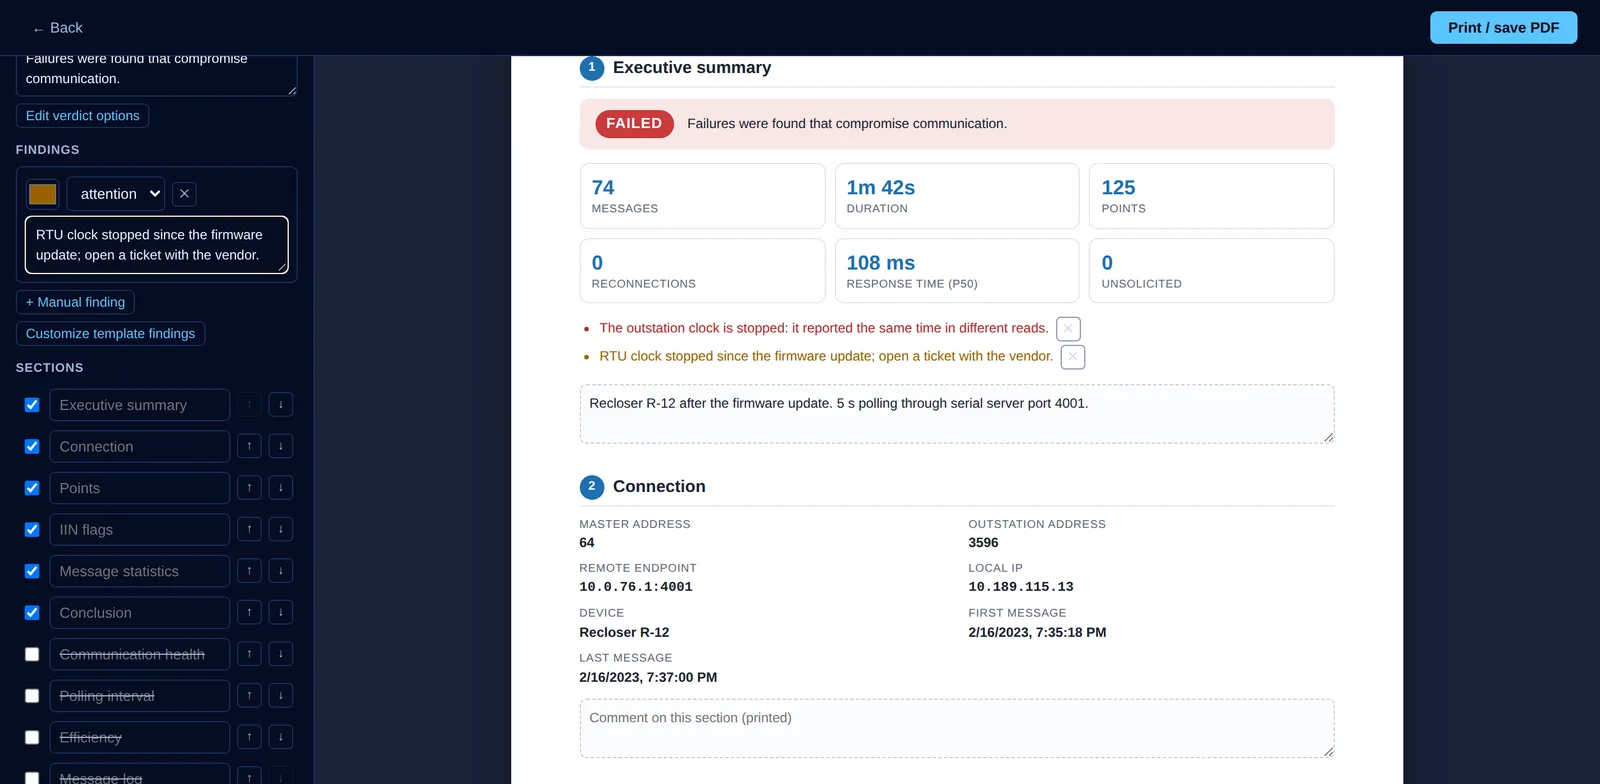
The platform writes the hard part: the verdict and the findings. You add the cover, your comments and highlights, and save the format as your team's template.
- Your cover — your organization's logo and the fields you need: client, contract, work order, firmware version.
- Your verdict — keep the automatic one or override it, add manual findings, change the wording, level and color of each one.
- Your sections — summary, connection, points, IIN, message statistics, communication health, polling, efficiency, message log: turn on, rename, reorder.
- Highlights in any color on the points and messages that matter, and a comment under every section.
- Organization templates — Homologation and Communication diagnosis built in; save yours and the whole team uses it.
- A whole channel in one document — one chapter and one verdict per RTU. Print or save as PDF, A4.
Homologation baseline
Save the exchange you approved. Compare every capture after it.
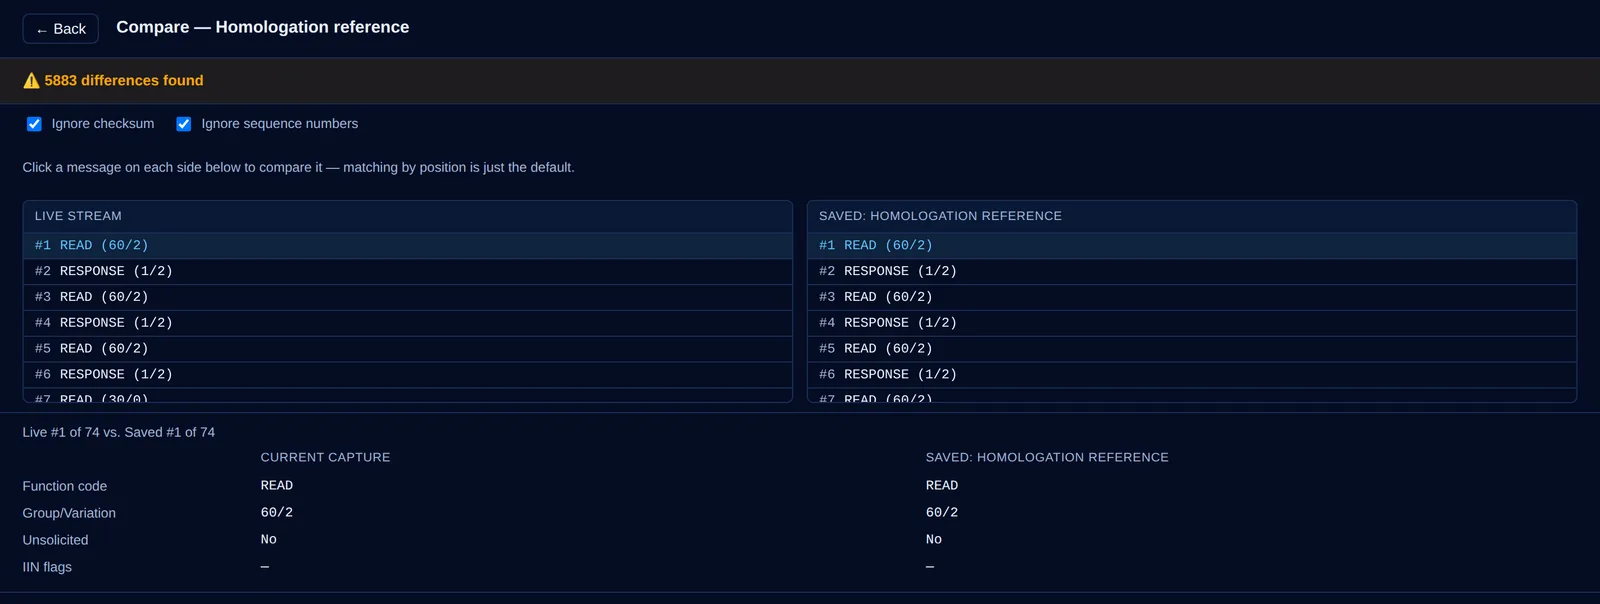
Approved an RTU at commissioning? Save that exchange as a reference, in your organization's folders. Months later — after a firmware update, a gateway swap, a new master — compare a fresh capture against it, field by field.
- Differences highlighted message by message, down to each field of each layer.
- Ignore checksums and sequence numbers to see only what really changed.
- Pick which message to compare on each side — matching by position is only the default.
Message statistics
Every message counted and classified
What the master and the RTU really exchanged, in numbers — no spreadsheet, no Wireshark filter.
- By group/variation and function code — how many times each object and each function appeared.
- IIN flags — how many responses carried each bit.
- Polling — every poll type with its typical, minimum and maximum interval, unanswered polls and response time p50/p90.
- Efficiency — empty class polls, unsolicited rate and confirmation, event delay, SELECT/OPERATE attempts and failures.
- The whole channel — all the RTUs behind a gateway side by side, with the channel's totals.
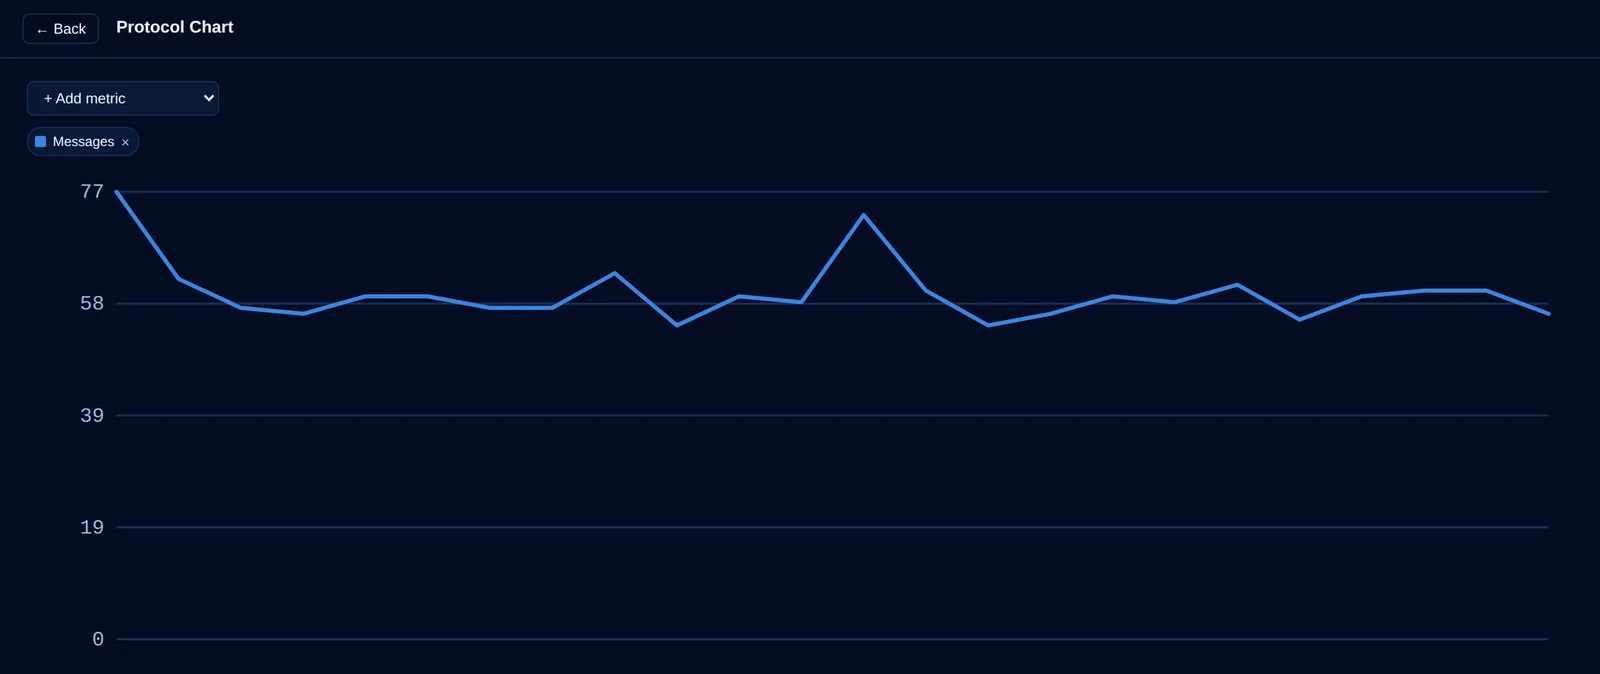
Traffic and latency over time
See when things changed, and how long the RTU takes to answer
A capture of hours is hard to read message by message. The charts show the whole period at once: where the traffic rose or dropped, where the master took longer to poll, and how fast each RTU really answers.
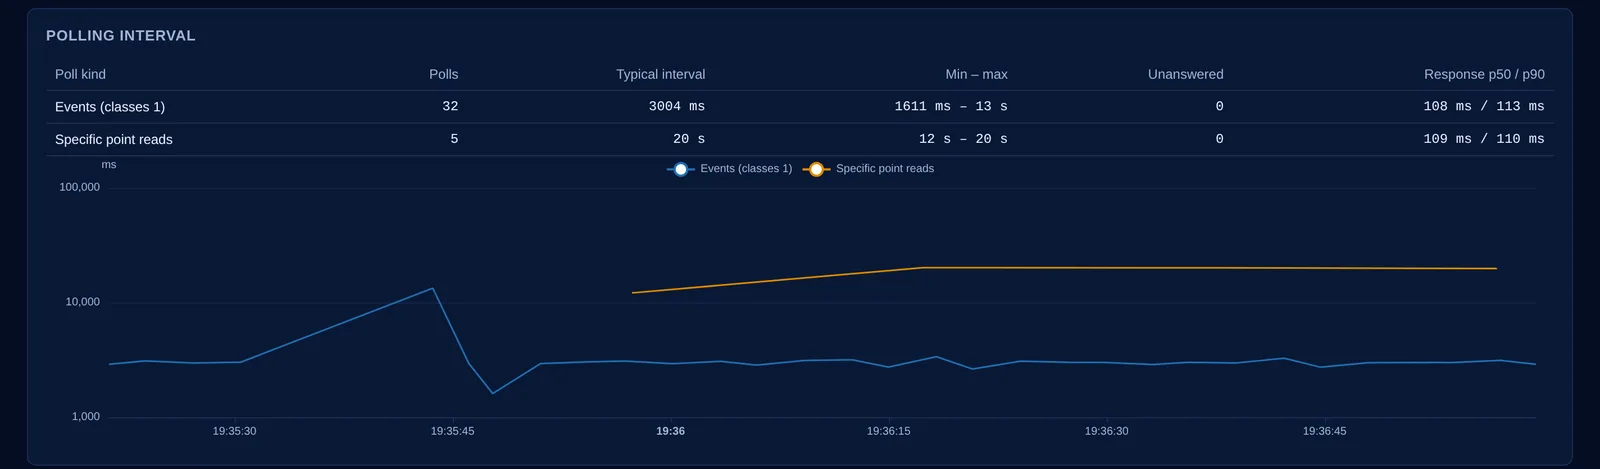
- Response time p50 and p99 for every RTU on the RTUs page, and a "slow responses" finding when an RTU lags behind.
- Time to acknowledge on every TCP segment, to tell a slow RTU from a slow network.
TCP layer
When it isn't DNP3, see the TCP underneath
Many "RTU failures" are the network. The TCP session shows every segment between master and RTU — flags, sequence numbers, window — and how long the other side took to acknowledge.
- Retransmissions, duplicate ACKs, keep-alives, zero window and segments missing from the capture flagged on the row itself.
- Reconnection history with the reason: the RTU closed it, the master reset it, or the link just went silent.
- Connection health in the report: reconnections, retransmissions and resets on a timeline.
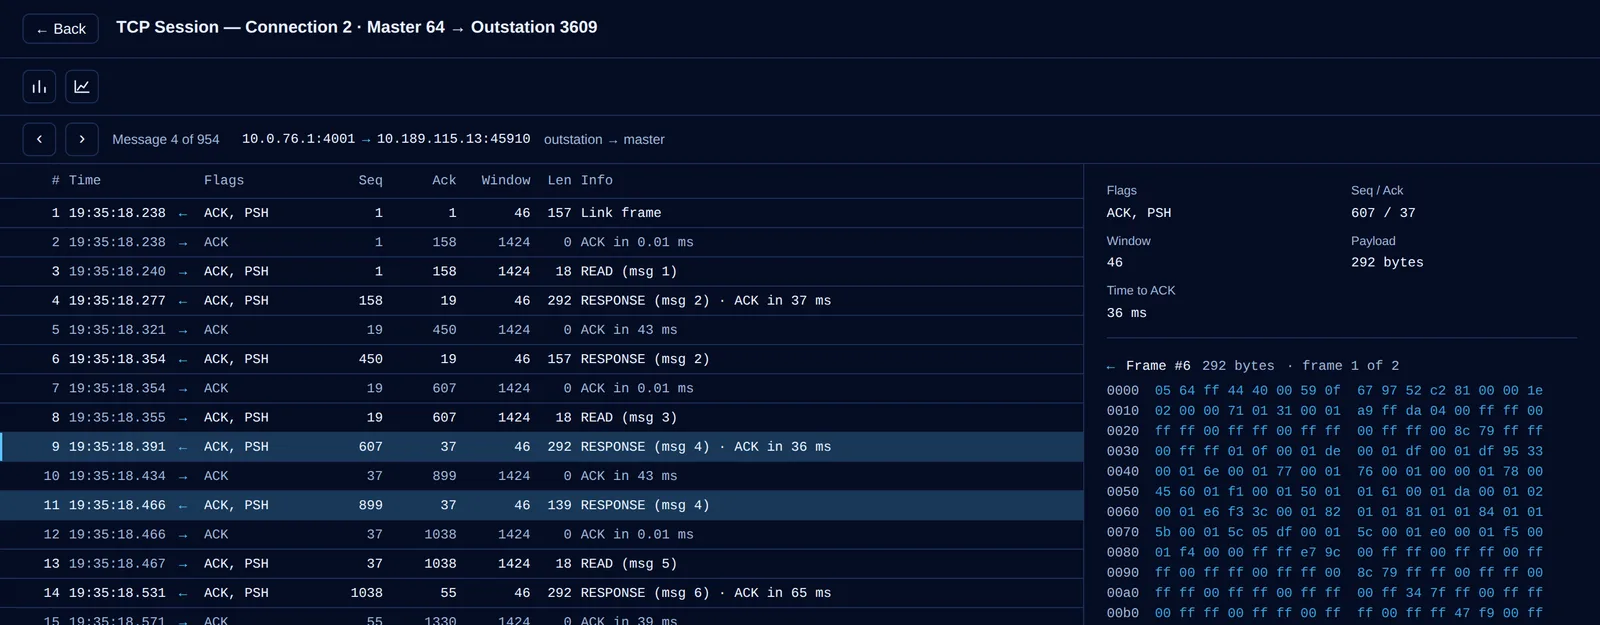
Down to the byte
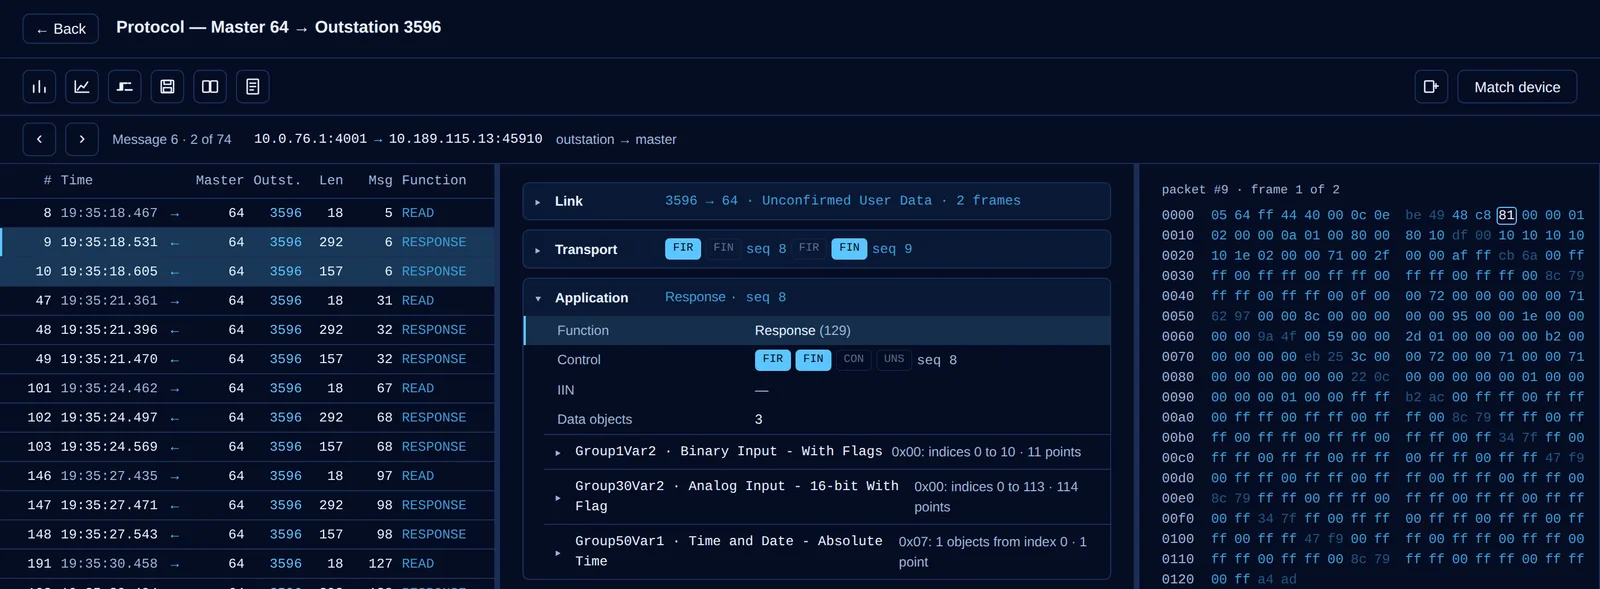
Click a field, see its bytes
Every message decoded layer by layer — link, transport, application — with the IIN bits and each point's value, quality and timestamp. Click any field and its bytes light up in the hex.
- Register the RTU as a device once and every point shows its name — in the decoder, the simulator and the report.
- One RTU or the whole channel: every RTU behind the same gateway in one list.
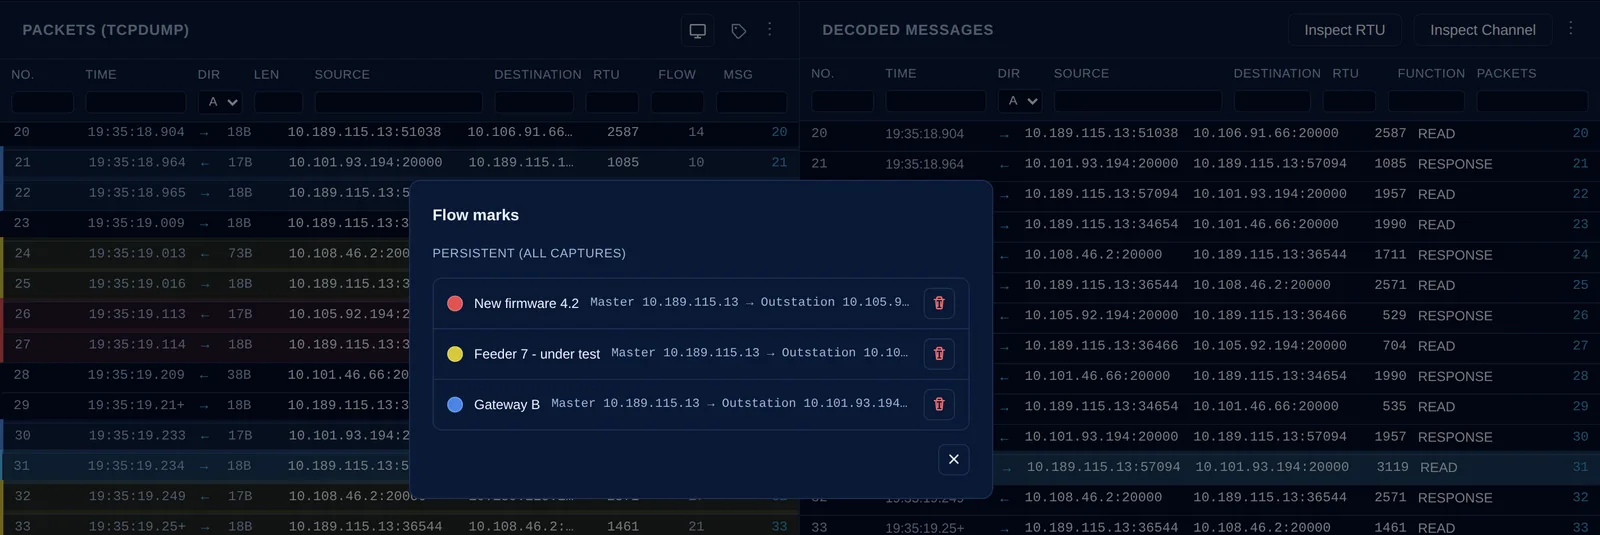
Packet marks
Color the RTU you are chasing
In a capture with dozens of connections, mark one with a color and a tag — "new firmware", "feeder 7", "under test" — and follow it through the noise.
- Any color, any tag, on every packet of that connection.
- Make it permanent and it comes back by itself in every future capture with the same master, RTU and port.
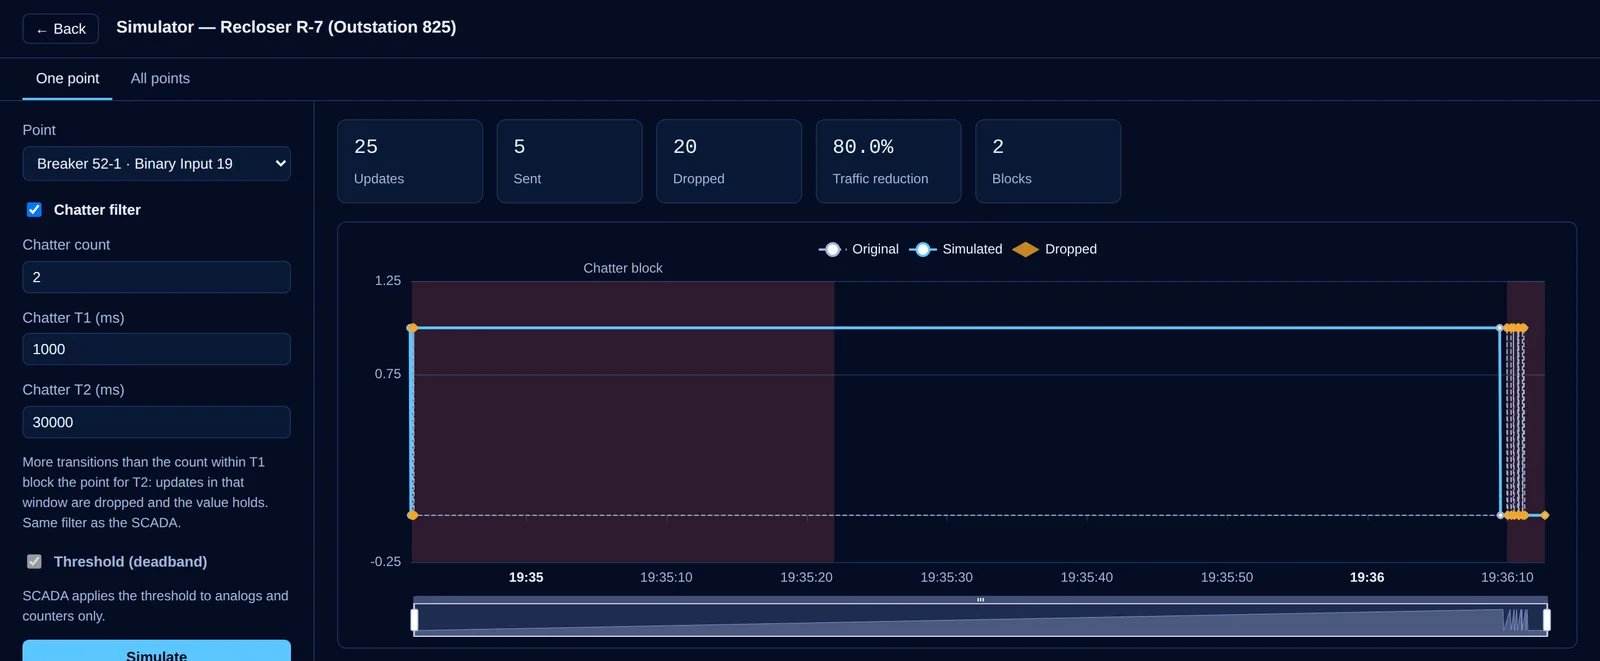
Chatter & threshold simulator
Tune the filter before you touch the field
Replay the real values of the capture through chatter and deadband filters and see exactly what would reach the operator — and how much traffic you would save.
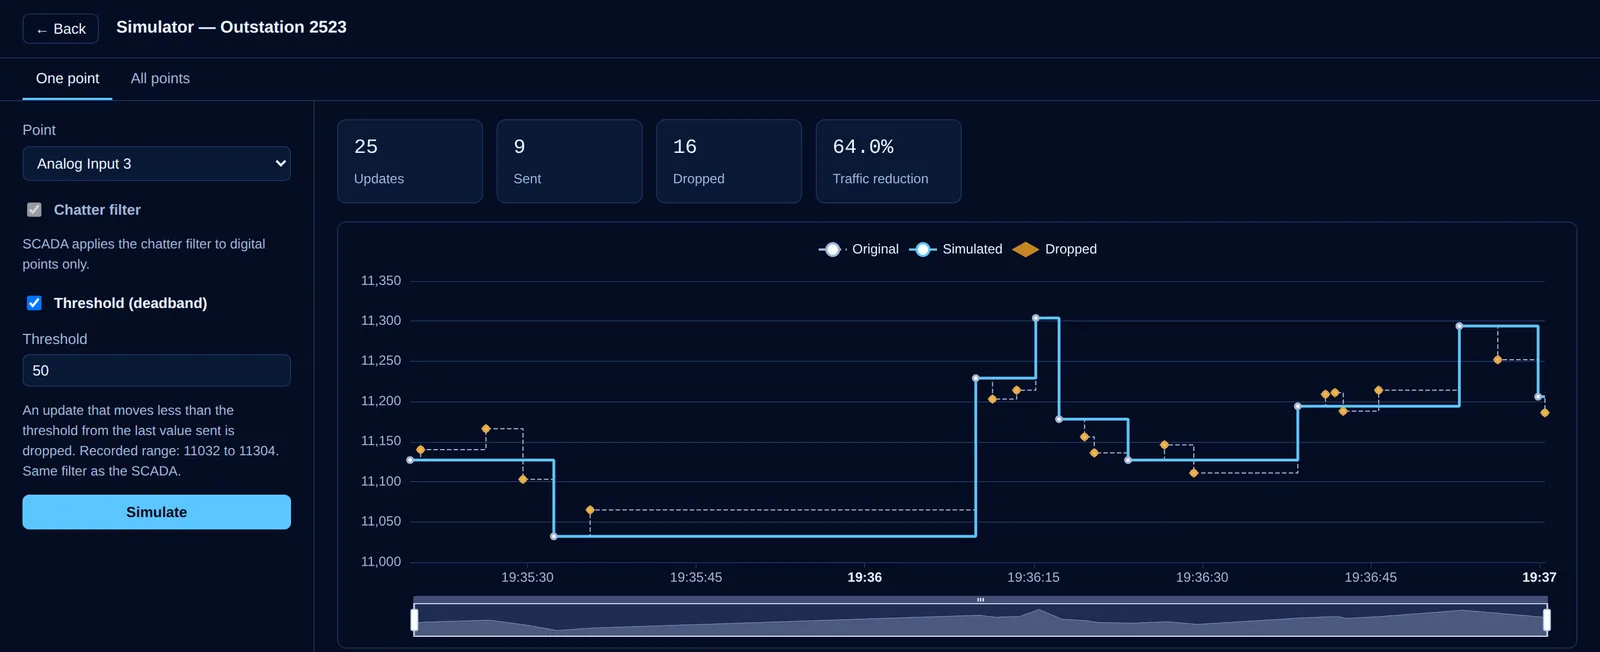
Or run both filters over every point of the RTU at once and rank the ones that would cut the most traffic.
Plans
Upload your first capture today
Create the account in under a minute, drop in a pcap, and see what your RTUs have been telling you.
Free plan
Free
1 user, 1,000 DNP3 messages/month, 100MB storage.
Creating an account takes less than a minute. Sign up and start using it right away.
Cancel anytime in a few clicks. Your plan stays active until the end of the period you paid for.
No account needed
Paste a DNP3 frame, see it decoded
This is the same parser the platform runs on every capture. Paste up to 10 hex-encoded DNP3 frames below, one per line, and see exactly what it sees.